
R packages and services
The majority of open-source code, software and packages contributed by ACEMS members is in the R language.
R is a leading open-source language and environment globally for both researchers and data scientists, enabling statistical computing, data analysis, graphics, applications specific to a range of domains (such as genetics, econometrics, clinical trials and environmental monitoring), and much more, as shown in the Comprehensive R Archive Network’s CRAN topic areas page. ACEMS R Software and Service highlights for 2020 include:
- at least 10 new R packages created and first published for free download on CRAN
- a total of 107 currently maintained on CRAN
- ACEMS members additionally making contributions of code, data, or packages, to other repositories such as GitHub. See Publicly Available Software.
- Updates being made to open source packages
- ACEMS members provided a range of services to enable end users and the public to learn about and use these R packages and other open source tools, including:
- speaking at conferences;
- delivering training workshops;
- hosting and participating in hackathons; and
- creating educational resources, including for schools and health professionals.
Each of the lectures were scheduled in the lunchtime timeslot locally, and although timezones were a factor, it was wonderful to attract the broader global mathematical and statistical community including audiences across Australia, as well as North and South America, Europe, Britain, Asia, India, Middle East and New Zealand. ACEMS was incredibly impressed with the interest in the lecture series with more than 1200 individual logons across the 9-lecture series, and with dynamic discussion via the Q & A feature.
New R Packages Created in 2020
ACEMS members added at least ten R packages to CRAN in 2020. See Table 1 below for details. Note that this list is not exhaustive with respect to either R or other open source packages created by ACEMS members. For example, R code and packages are often outputs of collaborative research projects, such as this free software program "Predicting seagrass decline due to cumulative stressors", and may be shared in other repositories such as GitHub.
| Table 1: Details of Some New R Packages Created in 2020 by ACEMS members and collaborating authors | ||||
|---|---|---|---|---|
| R package | Maintainer | Package Title | Description | Downloads Count; monthly average |
| distributional | Mitchell O'Hara-Wild | Vectorised Probability Distributions | The distributional package allows distributions to be used in a vectorised context. Vectorised distribution objects with tools for manipulating, visualising, and using probability distributions. Designed to allow model prediction outputs to return distributions rather than their parameters, allowing users to directly interact with predictive distributions in a data-oriented workflow. In addition to providing generic replacements for p/d/q/r functions, other useful statistics can be computed including means, variances, intervals, and highest density regions. | 14,6775; 12,231 |
| fable.prophet | Mitchell O'Hara-Wild | Prophet Modelling Interface for 'fable' | Allows prophet models from the 'prophet' package to be used in a tidy workflow with the modelling interface of 'fabletools'. This extends 'prophet' to provide enhanced model specification and management, performance evaluation methods, and model combination tools. | 8282; 690 |
| seer | Thiyanga Talagala | Feature-Based Forecast Model Selection | A novel meta-learning framework for forecast model selection using time series features. Many applications require a large number of time series to be forecast. Providing better forecasts for these time series is important in decision and policy making. We propose a classification framework which selects forecast models based on features calculated from the time series. We call this framework FFORMS (Feature-based FORecast Model Selection). FFORMS builds a mapping that relates the features of time series to the best forecast model using a random forest. 'seer' package is the implementation of the FFORMS algorithm. For more details read the paper. | 7616; 635 |
| airt | Sevvandi Kandanaarachchi | Evaluation of Algorithm Collections Using Item Response Theory | An evaluation framework for algorithm portfolios using Item Response Theory (IRT). We use continuous and polytomous IRT models to evaluate algorithms and introduce algorithm characteristics such as stability, effectiveness and anomalousness (Kandanaarachchi, Smith-Miles 2020) <doi:10.13140/RG.2.2.11363.09760>. | 5230; 436 |
| gratis | Yanfei Kang | Generating Time Series with Diverse and Controllable Characteristics | Generates time series based on mixture autoregressive models. Kang,Y.,Hyndman,R.,Li,F.(2020)<doi:10.1002/sam.11461>. | 4412; 368 |
| nortsTest | Asael Alonzo Matamoros | Assessing Normality of Stationary Process | Despite that several tests for normality in stationary processes have been proposed in the literature, consistent implementations of these tests in programming languages are limited. Four normality test are implemented. The Lobato and Velasco's, Epps, Psaradakis and Vavra, and the random projections tests for stationary process. Some other diagnostics such as, unit root test for stationarity, seasonal tests for seasonality, and arch effect test for volatility; are also performed. The package also offers residual diagnostic for linear time series models developed in several packages. | 3641; 303 |
| tsibbletalk | Earo Wang | Interactive Graphics for Tsibble Objects | A shared tsibble data easily communicates between htmlwidgets on both client and server sides, powered by 'crosstalk'. A shiny module is provided to visually explore periodic/aperiodic temporal patterns. | 2814; 234 |
| composits | Sevvandi Kandanaarachchi | Compositional, Multivariate and Univariate Time Series Outlier Ensemble | An ensemble of time series outlier detection methods that can be used for compositional, multivariate and univariate data. It uses the four R packages 'forecast', 'tsoutliers', 'otsad' and 'anomalize' to detect time series outliers. | 2559; 213 |
| DSjobtracker | Thiyanga S. Talagala | What Skills and Qualifications are Required for Data Science Related Jobs? | Dataset containing information about job listings for data science job roles. | 1514; 126 |
| brolgar | Nick Tierney | BRowse Over Longitudinal Data Graphically and Analytically in R | Brolgar helps you browse over longitudinal data graphically and analytically in R, by providing tools to: efficiently explore raw longitudinal data; calculate features (summaries) for individuals; and evaluate diagnostics of statistical models This helps you go from a messy “plate of spaghetti” plot to “interesting observations”. The tools and workflows in brolgar are designed to work with a special tidy time series data frame called a tsibble. We can define our longitudinal data in terms of a time series to gain access to some really useful tools. To do so, we need to identify three components: 1. the key variable in your data is the identifier of your individual; 2. the index variable is the time component of your data; 3. he regularity of the time interval (index). Longitudinal data typically has irregular time periods between measurements, but can have regular measurements. Together, time index and key uniquely identify an observation. | 1447; 121 |
Current ACEMS Packages Maintained
ACEMS members maintain a diversity of R Packages which remain popular amongst CRAN’s diversity of international users. There are currently 107 R Packages created by ACEMS members and maintained on CRAN; Table 2 below provides the details and total user download numbers in descending order. Whilst total downloads are an indicator of value to end users, some packages with smaller downloads may have niche user groups and/or otherwise deliver significant impact from use.
The most popular R Package by download is rmarkdown – with more than 2.4 million total downloads by CRAN users.
The significant number of downloads of R packages is indicative of the value and utility of these packages.
Total downloads of ACEMS members’ R packages on CRAN number:
- 19,870,453 total downloads of the CRAN packages during 2020
- 38,592,624 total downloads of the CRAN packages since 2019
- 53,735,049 total downloads of the CRAN packages since 2016
| Table 2: Downloads for all ACEMS members’ R packages maintained and updated on CRAN | |||
|---|---|---|---|
| R Package | Maintainer | Current version | User downloads |
| rmarkdown | Yihui Xie | 2.7 | 24709717 |
| forecast | Rob J Hyndman | 8.14 | 8757355 |
| fracdi | Martin Maechler | 1.5-1 | 5436168 |
| GGally | Barret Schloerke | 2.1.1 | 2753057 |
| KernSmooth | Brian Ripley | 2.23-18 | 1671269 |
| DescTools | Andri Signorell | 0.99.41 | 1497503 |
| expsmooth | Rob J Hyndman | 2.3 | 1374944 |
| fma | Rob J Hyndman | 2.4 | 912293 |
| fpp | Rob J Hyndman | 0.5 | 740974 |
| imputeTS | Steen Moritz | 3.2 | 682535 |
| naniar | Nicholas Tierney | 0.6.0 | 340371 |
| fpp2 | Rob J Hyndman | 2.4 | 326577 |
| visdat | Nicholas Tierney | 0.5.3 | 323522 |
| hts | Earo Wang | 6.0.1 | 322147 |
| tsibble | Earo Wang | 1.0.1 | 309589 |
| hdrcde | Rob J Hyndman | 3.4 | 217990 |
| rainbow | Han Lin | 3.6 | 176498 |
| tsfeatures | Rob J Hyndman | 1.0.2 | 174831 |
| thief | Rob J Hyndman | 0.3 | 173083 |
| fabletools | Mitchell O'Hara-Wild | 0.3.1 | 170029 |
| distributional | Mitchell O'Hara-Wild | 0.2.2 | 146775 |
| fable | Mitchell O'Hara-Wild | 0.3.0 | 142023 |
| xaringan | Yihui Xie | 0.2 | 141264 |
| ggmosaic | Haley Jeppson | 0.3.3 | 131162 |
| feasts | Mitchell O'Hara-Wild | 0.2.1 | 128994 |
| fds | Han Lin | 1.8 | 125116 |
| ftsa | Han Lin | 6.0 | 119576 |
| Mcomp | Rob J Hyndman | 2.8 | 112929 |
| demography | Rob J Hyndman | 1.22 | 81649 |
| TSclust | Pablo Montero | 1.3.1 | 78194 |
| bfast | Jan Verbesselt | 1.5.7 | 52654 |
| tsibbledata | Mitchell O'Hara-Wild | 0.3.0 | 47950 |
| LowRankQP | John T Ormerod | 1.0.4 | 47304 |
| feature | Tarn Duong | 1.2.15 | 47202 |
| fpp3 | Rob J Hyndman | 0.4.0 | 44904 |
| season | Adrian Barnett | 0.3.12 | 43720 |
| tourr | Di Cook | 0.6.0 | 41058 |
| robets | Ruben Crevits | 1.4 | 39863 |
| SSN | Jay VerHoef | 1.1.15 | 36810 |
| geozoo | Barret Schloerke | 0.5.1 | 36024 |
| CEoptim | Benoit Liquet | 1.2 | 35225 |
| sugrrants | Earo Wang | 0.2.8 | 34381 |
| bayesImageS | Matt Moores | 0.6-1 | 34332 |
| nullabor | Di Cook | 0.3.9 | 34125 |
| geomnet | Sam Tyner | 0.3.1 | 32010 |
| vegawidget | Ian Lyttle | 0.3.2 | 31099 |
| shinycustomloader | Emi Tanaka | 0.9.0 | 29336 |
| vitae | Mitchell O’Hara-Wild | 0.4.2 | 29200 |
| stR | Alexander Dokumentov | 0.4 | 28089 |
| dma | Hana Sevcikova | 1.4-0 | 27096 |
| DescribeDisplay | Di Cook | 0.2.7 | 26813 |
| staplr | Priyanga Dilini Talagala | 3.1.1 | 25893 |
| curvHDR | Matt Wand | 1.2-1 | 25813 |
| dobson | Adrian Barnett | 0.4 | 24995 |
| MissingDataGUI | Xiaoyue Cheng | 0.2-5 | 23737 |
| emma | Laura Villanova | 0.1-0 | 23638 |
| ggenealogy | Lindsay Rutter | 1.0.1 | 23452 |
| edrGraphicalTools | Benoit Liquet | 2.2 | 23120 |
| rwalkr | Earo Wang | 0.5.5 | 23111 |
| binb | Dirk Eddelbuettel | 0.0.6 | 21181 |
| gammSlice | Matt Wand | 2.0-2 | 20755 |
| sgPLS | Benoit Liquet | 1.7 | 20159 |
| eechidna | Jeremy Forbes | 1.4.1 | 20140 |
| queuecomputer | Anthony Ebert | 1.1.0 | 19487 |
| BSL | Ziwen An | 3.2.0 | 18893 |
| ggquiver | Mitchell O’Hara-Wild | 0.2.0 | 17896 |
| MergeGUI | Xiaoyue Cheng | 0.2-1 | 17602 |
| MatTransMix | Xuwen Zhu | 0.1.13 | 17202 |
| MBSGS | Benoit Liquet | 1.1.0 | 17188 |
| smoothAPC | AlexanderD okumentov | 0.3 | 16187 |
| colmozzie | Thiyanga Talagala | 1.1.1 | 16182 |
| binostics | Ursula Laa | 0.1.3 | 14425 |
| diffpriv | Benjamin Rubinstein | 0.4.2 | 14239 |
| mozzie | Thiyanga Talagala | 0.1.0 | 14177 |
| gimmEP | Matt Wand | 1.0-3.1 | 13673 |
| PPforest | Natalia da Silva | 0.1.1 | 13670 |
| quokar | Wenjing Wang | 0.1.0 | 13031 |
| serrsBayes | Matt Moores | 0.4-1 | 12518 |
| ozmaps | Michael Sumner | 0.4.0 | 11692 |
| tourrGui | Di Cook | 0.4 | 11611 |
| HRW | Matt Wand | 1.0-4 | 11085 |
| starmie | Stuart Lee | 0.1.2 | 10678 |
| spinifex | Nicholas Spyrison | 0.2.7 | 10349 |
| taipan | Stephanie Kobakian | 0.1.2 | 10136 |
| gravitas | Sayani Gupta | 0.1.3 | 9742 |
| dobin | Sevvandi Kandanaarachchi | 1.0.2 | 9503 |
| fable.prophet | Mitchell O’Hara-Wild | 0.1.0 | 8282 |
| sugarbag | Stephanie Kobakian | 0.1.3 | 7879 |
| seer | Thiyanga Talagala | 1.1.5 | 7616 |
| stray | Priyanga Dilini Talagala | 0.1.1 | 7506 |
| eventstream | Sevvandi Kandanaarachchi | 0.1.0 | 7425 |
| oddstream | Priyanga Dilini Talagala | 0.5.0 | 6562 |
| syn | Nicholas Tierney | 0.1.0 | 6244 |
| airt | Sevvandi Kandanaarachchi | 0.2.0 | 5230 |
| gratis | Yanfei Kang | 0.2.1 | 4412 |
| spinebil | Ursula Laa | 0.1.0 | 4199 |
| nortsTest | Asael Alonzo Matamoros | 1.0.0 | 3641 |
| tsibbletalk | Earo Wang | 0.1.0 | 2814 |
| composits | Sevvandi Kandanaarachchi | 0.1.0 | 2559 |
| DSjobtracker | Thiyanga Talagala | 0.1.1 | 1514 |
| brolgar | Nicholas Tierney | 0.1.0 | 1447 |
| bayesforecast | Asael Alonzo Matamoros | 0.0.1 | 1166 |
| lookout | Sevvandi Kandanaarachchi | 0.1.0 | 933 |
| spotoroo | Weihao Li | 0.1.1 | 391 |
| nestr | Emi Tanaka | 0.1.1 | 363 |
| ferrn | H. Sherry Zhang | 0.0.1 | 342 |
| MedLEA | Thiyanga Talagala | 1.0.1 | 35 |
R Services
ACEMS members contribute to the understanding, adoption, and use of open source tools, including R packages, through their work in running R events - such as hackathons (creating and applying R tools), speaking at conferences, delivering training workshops, and producing guides.
Below is an overview of these types of R Services provided by ACEMS members in 2020.
Hackathons
In February 2020, before COVID-19 lockdowns, ACEMS Monash hosted an R hackathon for academia and industry. It was attended by ACEMS Partner Organisation AT&T’s Emily Dodwell who was visiting ACEMS nodes from AT&T New York. Emily is an R enthusiast, committed to promoting gender diversity in the community, an organizer of R-Ladies New York City, and a member of R Forwards - the R Foundation task force on women and other under-represented groups.
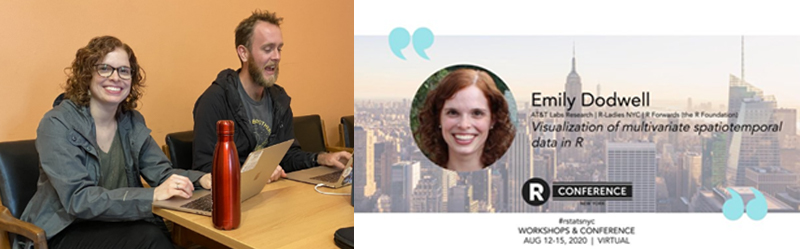
ACEMS Monash R hackathon participants, including ACEMS Partner AT&T’s Emily Dodwell pictured with ACEMS Nick Tierney, an R package author, and a promotion for Emily’s presentation at the R Conference New York featuring collaborative work with ACEMS’ Di Cook
Presentations and Workshops
The following presentations/workshops were delivered by ACEMS members/partners in 2020:
- R Studio Conference, San Francisco, January 2020
- ACEMS CI Rob Hyndman presented on the topic "Tidy Time Series and Forecasting in R" and also discussed his open source software for forecasting. Learn more here
- He also presented on the topic "How Rmarkdown changed my life", speaking about its use as an open source document format for reproducibility that his research group now almost exclusively uses for its papers. Learn more here
- R Conference New York, Held Virtually, August 12-15, 2020
- Emily Dodwell presented on the topic “Visualisation of multivariate spatiotemporal data in R”, based on her research with ACEMS AI Di Cook. They created a Shiny app and other outputs shared here.
- Rob Hyndman presented on the topic "Ensemble forecasts with fable", discussing some of his open source work and fable package. Learn more here
- ACEMS Annual Retreat 2020
- The collaborative work by Di Cook and Emily Dodwell, harnessing both open source data and tools they created, including for understanding fire ignition was presented at the ACEMS Annual Retreat.
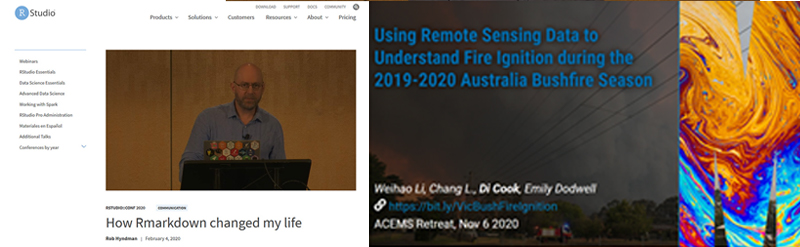
Watch the presentation on “Rmarkdown” or use of open source data/tools for understanding Bushfire Ignition
Podcasts / Interviews
Rob Hyndman has featured in various podcasts covering open source software topics, including:
- The Curious Quant - Forecasting COVID, time series, and why causality doesn’t matter as much as you think
- The Random Sample - Forecasting the future & the future of forecasting

Publishing Guides and Online Textbooks
ACEMS members have been actively educating others to harness open source tools. In 2020, some key resources further developed include:
- The online guide: “Developing a Cancer Atlas using Bayesian Methods: A Practical Guide for Application and Interpretation” with open source tools, developed by ACEMS and Cancer Council Queensland researchers.
- The free online textbook “Forecasting: Principles and Practice” by Rob Hyndman and George Athanasopoulos, written for business (forecasting) professionals and students, which references R open source software throughout the book and teaches readers how to forecast with R.
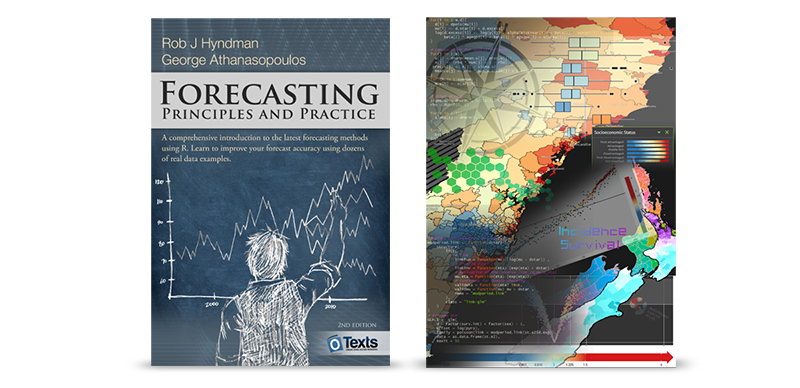
Above: free online forecasting textbook referencing R tools, and the Cancer Atlas guide